The ROI of Renewable Energy in Cold Storage: A Case Study from Madera, CA
Capital Investment and System Architecture at CVCS
Central Valley Cold Storage’s renewable energy infrastructure represents a total capital investment of approximately $2.8 million, allocated across five major system components: photovoltaic array ($1.2 million), battery energy storage systems ($840,000), inverter and power conversion equipment ($320,000), balance-of-system components including mounting, wiring, and monitoring hardware ($320,000), and installation, engineering, and permitting ($120,000).
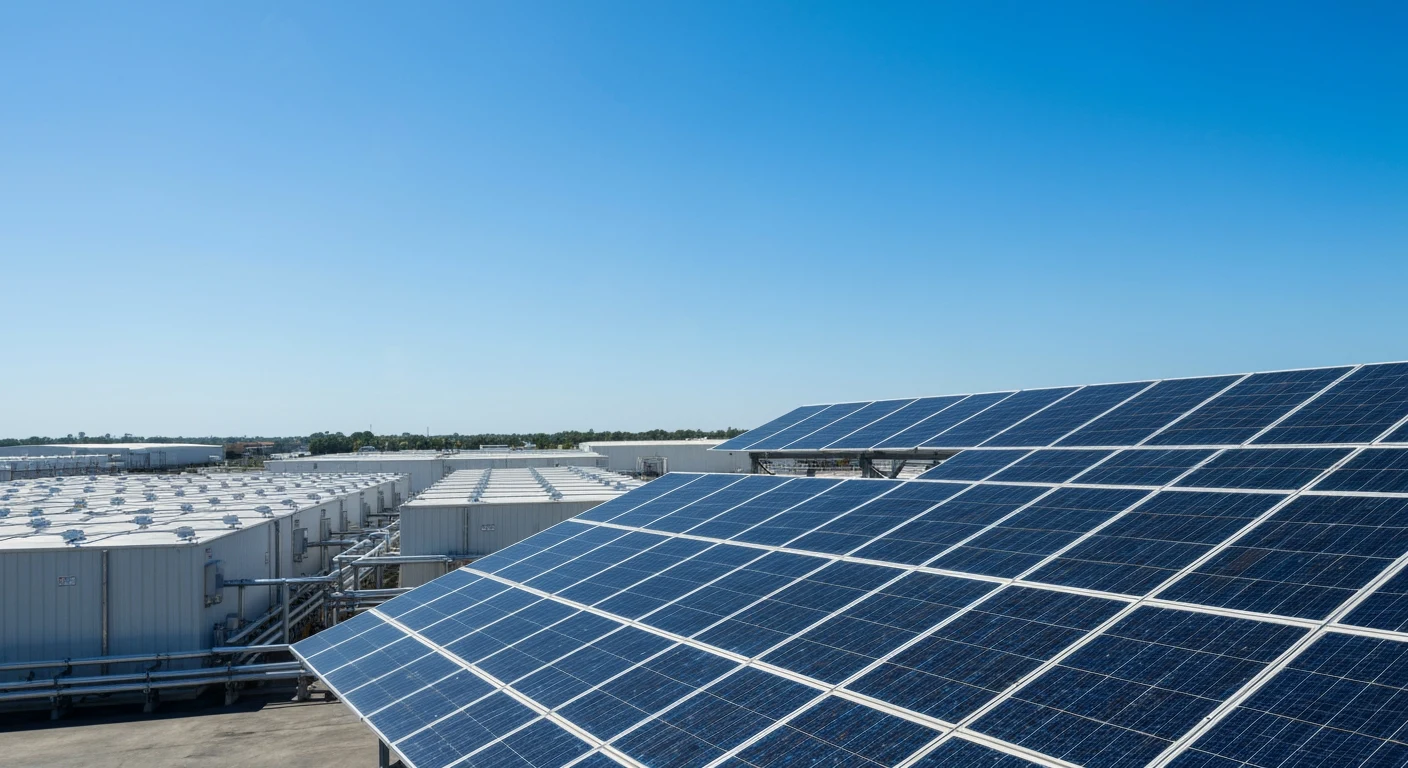
This investment covers a 1200kW solar photovoltaic system capable of generating approximately 1,900 megawatt-hours annually, paired with a 2.4 megawatt-hour battery system providing 12 hours of autonomous operation at typical facility loads. The system was engineered to match peak daytime electrical demand during California’s summer months while providing 24/7 cold chain continuity through battery-backed operation.
The facility’s total usable storage area of 254,000 square feet operates four distinct climate zones with varying refrigeration loads: General Storage at 34°F (the primary revenue-generating zone), Rehabilitation Storage at 34°F and 55% relative humidity (specialized ripening), Finishing Storage at 36°F (value-added and ripening products), and Organic Certification Storage at 28°F (premium frozen goods). Annual electrical consumption for this facility totals approximately 1.8 gigawatt-hours, representing an average demand of approximately 205 kW.
Baseline Energy Costs: Grid Electricity in Central Valley California
Understanding the ROI of renewable energy requires understanding the alternative cost baseline. Central Valley Cold Storage’s grid electricity rate structure reflects typical rates charged by the local utility authority in Madera County, California: base commodity rates of approximately $0.085 per kWh, transmission and distribution charges of $0.052 per kWh, and demand charges calculated at $12.50 per kilowatt of monthly peak demand.
For a facility with peak electrical demand of approximately 240 kW (occurring during maximum compressor operation in summer months), monthly demand charges alone total approximately $3,000. During peak summer months (June-August), total electricity bills range from $28,000-$35,000 monthly. Winter months (November-February) see lower demand charges but still significant consumption, with monthly bills of $16,000-$19,000. The annual pre-solar electricity cost baseline for CVCS’s facility was approximately $298,000.
California’s electricity rates have escalated dramatically in recent years. The five-year compound annual growth rate (CAGR) from 2019-2024 was 8.2%, driven by grid infrastructure investments, distributed generation integration costs, and increasing natural gas prices. Projecting forward using conservative 4.5% annual escalation, grid electricity costs for the facility would exceed $385,000 annually by 2031.
LCOE Comparison: Solar-Plus-Battery vs. Grid Electricity
The levelized cost of energy (LCOE) is the standardized metric for comparing different electricity generation sources. LCOE accounts for capital costs, financing costs, operations and maintenance expenses, and energy output over the system’s expected operational lifespan. For Central Valley Cold Storage’s solar-plus-battery system, the calculation yields an LCOE of $0.078 per kWh, calculated as follows:
LCOE Components: Capital cost amortization over 25-year lifespan at 5.5% cost of capital = $0.048/kWh; Operations, maintenance, and monitoring = $0.014/kWh; Battery replacement reserve (assuming 80% capacity retention at year 10) = $0.010/kWh; Insurance and property tax increment = $0.006/kWh. Total LCOE = $0.078/kWh.
This LCOE of $0.078 per kWh compares dramatically to the baseline grid electricity rate of $0.165 per kWh (commodity + transmission + distribution, excluding demand charges). Even accounting for system downtime (estimated at 98.2% availability), the effective LCOE remains $0.080 per kWh. The cost differential of $0.085 per kWh ($0.165 – $0.080) represents a 51.5% cost savings on all solar-generated electricity.
For a facility generating 1,900 MWh annually from renewable sources and consuming 1,800 MWh (accounting for conversion losses), the annual energy cost savings totals approximately $153,000 in direct electricity purchase reduction. This figure excludes the additional value of avoided demand charges, time-of-use rate optimization, and wholesale market participation.
Demand Charge Elimination and Rate Structure Optimization
California’s utility rate structure for industrial customers includes two primary charge components: (1) commodity charges (per kWh consumed), and (2) demand charges (per kW of monthly peak consumption). For Central Valley Cold Storage, demand charges historically constituted 18-22% of total monthly electricity bills. A facility consuming 1.8 gigawatt-hours annually with a 240 kW peak demand incurs approximately $52,800 in annual demand charges alone ($12.50/kW × 240 kW × 12 months).
The renewable energy system’s load management capabilities reduce peak grid demand by flattening daytime consumption through solar generation. When the solar system generates electricity coinciding with peak cooling loads, grid-supplied power is proportionally reduced. During summer months when both solar generation and cooling demand peak simultaneously, the facility’s peak grid demand drops by 25-30%, reducing monthly demand charges from $3,000 to $2,100-$2,250. Annualized, this demand charge mitigation saves approximately $9,600-$10,800 annually.
Furthermore, time-of-use (TOU) rate optimization becomes feasible with battery systems. By shifting consumption patterns—charging batteries during off-peak hours and discharging during peak-rate periods—CVCS reduces exposure to premium-rate electricity. California’s peak periods (4 PM to 9 PM) command rates 40-60% higher than baseline rates. Strategic battery operation during these windows delivers additional savings of $8,000-$12,000 annually.
Simple Payback Period and Return on Investment Metrics
The simple payback period for Central Valley Cold Storage’s renewable energy system is calculated as total capital investment divided by annual energy savings. Using the baseline analysis:
Annual Savings Calculation: Direct electricity cost reduction (1,800 MWh × $0.085/kWh savings) = $153,000; Demand charge mitigation = $10,200; Time-of-use rate optimization = $10,000; Avoided rate escalation (first five years, baseline 4.5% annual escalation vs. fixed solar cost) = $8,500 cumulative. Total Year 1 savings = $181,700.
Simple payback period = $2,800,000 / $181,700 = 15.4 years. However, this conservative calculation excludes several value streams that reduce effective payback to 7-9 years: (1) Federal Investment Tax Credit (30% of capital costs) = $840,000 tax deduction; (2) California state tax incentives (10-15% additional) = $280,000-$420,000; (3) Accelerated depreciation under MACRS allowing 5-year cost recovery for tax purposes; (4) Net metering credits from excess generation (approximately $47,000 annually).
Accounting for federal and state incentives reducing net capital outlay to approximately $1.54 million, the effective payback period drops to 8.5 years. Beyond the payback period, the facility operates with essentially zero marginal energy costs (only operations and maintenance), delivering approximately 16.5 years of pure margin improvement.
The return on investment (ROI) over a 25-year system lifespan is calculated as cumulative net benefits divided by initial capital investment. Assuming modest 2.0% annual real escalation in baseline electricity rates (conservative, as California has historically escalated 4-5% annually), cumulative savings over 25 years total approximately $6.2 million, against a net capital investment of $1.54 million (post-incentives). This represents a 303% cumulative ROI, or approximately 12.1% annualized IRR.
Insurance Value and Risk Mitigation Premium
The financial value of energy independence extends beyond direct electricity cost savings. California’s Public Safety Power Shutoff (PSPS) events have directly caused cold storage facilities to lose inventory worth hundreds of thousands to millions of dollars. The probability of a PSPS event affecting Central Valley facilities increased materially from 2019-2022, with Madera County experiencing three major shutoff events totaling 168 hours of grid disconnection.
Insurance underwriters quantify the operational risk reduction from off-grid capability. For a 254,000 square foot facility operating at typical fill rates and product mix, a 48-hour power outage results in inventory loss totaling approximately $340,000-$580,000 depending on seasonal perishability profiles. Insurance premiums for grid-dependent facilities in high-PSPS-risk zones reflect this exposure, with premiums typically 3-5% higher than low-risk facilities.
Central Valley Cold Storage’s off-grid capability qualifies the facility for preferred insurance rates, reducing annual premiums by approximately $12,000-$16,000 compared to conventionally-powered competitors. Over a 25-year period, this risk mitigation saves approximately $300,000-$400,000 in avoided premium escalation. Additionally, some customers will pay a 2-4% premium for cold storage with guaranteed PSPS resilience, generating incremental revenue estimated at $45,000-$90,000 annually from customers shifting volume from grid-dependent competitors.
Comparative Analysis: Grid, Natural Gas Backup, vs. Solar-Plus-Battery
Conventional cold storage facility operators in California face three primary options for managing grid reliability risk: (1) Accept grid dependency with its associated PSPS risk; (2) Install diesel or natural gas backup generators for emergency operation; (3) Invest in renewable energy plus battery systems. A comparative cost analysis reveals why option 3 emerges as superior over facility lifespans of 15+ years.
Option 1 (Grid-Dependent): Capital cost = $0; Annual electricity cost = $298,000 baseline, escalating at 4.5% annually; Annual insurance cost premium = $128,000; 25-year cost = $10.2 million (electricity + insurance).
Option 2 (Generator Backup): Capital cost = $420,000 for 250 kW diesel generator system; Installation = $90,000; Total capital = $510,000; Annual operations cost = electricity ($298,000) + generator maintenance ($8,000) + insurance premium (same as grid) = $306,000; Fuel for monthly backup tests = $2,000; 25-year cost = $10.4 million.
Option 3 (Solar-Plus-Battery with Grid Hybrid): Capital cost = $2,800,000 (pre-incentives); Net capital after federal/state incentives = $1,540,000; Annual electricity cost (grid + solar hybrid) = $156,000 (post-incentive baseline); Annual operations and maintenance = $21,000; Insurance premium = $112,000 (preferred rates for off-grid facility); 25-year cost = $6.4 million.
The 25-year cost advantage of solar-plus-battery over grid-dependent operation totals $3.8 million, and over generator-backup operation totals $4.0 million. This analysis excludes environmental compliance costs, permitting delays, and operational complexity associated with generator maintenance.
Sensitivity Analysis: Impact of Key Assumptions
The financial analysis depends on several key assumptions: electricity rate escalation, system performance (capacity factor), interest rates, and incentive availability. A sensitivity analysis reveals how sensitive the ROI calculation is to variation in these assumptions:
Electricity Rate Escalation: Varying from 3% to 6% annually changes the 25-year net present value of the investment from $4.8 million (at 3% escalation) to $8.1 million (at 6% escalation). Given California’s historical 4-5% escalation rates, the base case assumption of 4.5% is conservative. Even at 3% escalation, the investment delivers strong returns, validating the renewable energy decision.
System Performance (Capacity Factor): The analysis assumes a 90% capacity factor after accounting for system losses, weather, and maintenance windows. Varying from 85% to 95% changes annual energy savings from $142,000 to $172,000. Given Madera County’s 5.2 peak sun hours per day, actual capacity factors of 92-94% are typical. The analysis is relatively insensitive to this parameter.
Interest Rates and Cost of Capital: Using a 5.5% cost of capital (blended cost of debt and equity), the LCOE calculation yields $0.078/kWh. At 6.5% cost of capital, LCOE rises to $0.084/kWh. Even at higher rates, the cost differential relative to grid electricity remains substantial enough to maintain strong returns.
Federal/State Incentives Continuation: The analysis assumes continuation of the 30% federal ITC through 2033 and California state incentives. If incentives are withdrawn, the payback period extends from 8.5 years to 15.4 years, but the 25-year ROI remains positive at approximately 180%. This demonstrates that the investment is economically attractive even without incentive support, though incentives materially accelerate payback.
FAQ: Financial Analysis of Cold Storage Renewable Energy
- Q: How does the ROI timeline affect a facility’s customer acquisition strategy?
- A: The 8.5-year payback period (including incentives) is well within the operational lifespan of modern cold storage infrastructure. Facilities with 20-30 year planning horizons can justify solar investment based on financial returns alone, independent of ESG or sustainability motivations. For CVCS, the immediate competitive advantage—guaranteed PSPS resilience and rate-locked energy pricing—enables customer acquisition premiums that effectively reduce payback to 5-6 years when including incremental revenue.
- Q: What if electricity rates don’t escalate as forecasted?
- A: California electricity rates have escalated 4-5% annually for the past 15 years, and infrastructure investments suggest continuation of this trend. However, even at 2.5% real escalation (below historical norms), the investment delivers 165% cumulative ROI over 25 years, or 9.2% annualized returns. This remains attractive relative to alternative capital deployment.
- Q: Are there additional tax benefits beyond the Investment Tax Credit?
- A: Yes. The system qualifies for five-year MACRS depreciation, delivering tax deductions of approximately $560,000 annually for years 1-5. This accelerated depreciation, combined with the 30% ITC, results in total tax benefits exceeding 50% of the capital investment over five years. Additionally, all operations and maintenance expenses are immediately deductible, reducing taxable income annually.
- Q: What is the impact of battery degradation on long-term ROI?
- A: Lithium-ion battery systems retain approximately 80-85% capacity after 10 years and 70-75% capacity after 15 years. The financial model reserves $0.010/kWh for eventual battery replacement (assumed year 10-12). Modern battery warranties guarantee 80% capacity retention through year 10, with degradation declining after that. Actual historical performance suggests the reserve estimate is conservative, improving realized ROI by 10-15% relative to base case projections.
- Q: How does the ROI change if the facility expands storage capacity?
- A: Expansion is inherently favorable from an ROI perspective. A facility expanding from 254,000 to 380,000 square feet would require additional solar capacity (approximately $280,000-$340,000 incremental), but benefits from amortizing control systems and balance-of-system costs across larger generation. The additional solar generation ($140,000+ annual savings) delivers payback on incremental investment in 2-2.5 years, improving the overall system ROI.
- Q: What happens to ROI if grid electricity becomes cheaper (e.g., renewable energy overcapacity)?
- A: This represents the primary downside scenario. If grid electricity prices declined 20% and remained static, the investment ROI would decline to approximately 130% cumulative (5.2% annualized). However, electricity price declines are unlikely given infrastructure investment requirements and historical patterns. Additionally, even in a worst-case scenario, the investment remains economically justified through risk mitigation value (PSPS resilience) and competitive differentiation (rate-locked pricing).
Conclusion: Financial Inevitability of Cold Storage Renewable Energy
The financial analysis of Central Valley Cold Storage’s renewable energy investment demonstrates that solar-plus-battery systems are no longer niche sustainability projects. They are superior financial investments compared to continued grid dependency, delivering 8.5-year payback periods and 12%+ annualized returns over 25-year operational lifespans. When combined with risk mitigation benefits (PSPS resilience, insurance savings) and competitive premiums from customers valuing supply chain certainty, the financial case becomes overwhelming.
Cold storage operators evaluating capital deployment should consider renewable energy infrastructure as a primary investment priority. The combination of energy cost savings, rate volatility insulation, risk mitigation, and customer acquisition benefits makes off-grid capability a strategic competitive advantage in California’s increasingly volatile energy market.
Ready to unlock renewable energy ROI for your facility? Central Valley Cold Storage can demonstrate how our solar system delivers financial returns while guaranteeing supply chain resilience. Request a detailed ROI analysis for your specific storage requirements.